


Now we come to the main theme of the book: designed actions sampling. What exactly is this? There are a few different ways to answer that question. The answers are slightly different in length. We will start with the shortest answer:
Designed actions sampling is a new scientific method that works well in education.
What is new is that we have combined several established scientific perspectives, methods and techniques that have probably never been used together before, in education or elsewhere. These include clinical research, action research, experience sampling and coding of qualitative data.
But is a combination of established methods really a new method? Yes, that is what we want to argue here.[1] In addition to the novelty of the combination, we have also had to come up with some new and never before used research approaches.
A scientific method proven to work well in education
So how do we know that the method works well in education? You can never be completely sure. Educational institutions are complex organisations. A method may work well in one place but not so well in another. But over a nine-year period, we have experimented in many places with new ways of working scientifically with teachers, and have made many insights and advances as a result. Educational development projects have been carried out around Sweden, and also abroad.[2] The eleven examples in the book are all taken from these projects. After a number of unsuccessful attempts, we finally ended up with a scientific method that seemed to work better and better in more and more educational institutions. In 2019, it became clear from the feedback of teachers and managers that we had developed a combination method that worked really well. Given the lack of scientific methods that work well in education, this aspect is perhaps the most interesting here: that the method works for teachers.
Some positive effects we have seen
Now this is not a scientific article, so the focus here will not be on proving or convincing you as a reader that the method works well in education. We refer that question to other arenas.[3] Instead, this book is about describing and exemplifying the method in such a detailed form that you as a reader will be able to understand how and why it works for teachers, and be able to apply it in your own organisation. In part three, we will also discuss in more detail the positive effects we have seen and give our view of why we believe that this particular scientific method produces these positive effects.
Nevertheless, it is worth briefly mentioning some of the effects we have seen. These include:
- Simplified collaboration on teachers’ scientific work – greater clarity and better support for the four key roles that need to work together, see Figure 1.3.
- Visualisation of effects of different development ideas among students – both positive effects and lack of effects.
- Strengthened development leadership for managers – now it is finally possible to exercise pedagogical leadership, they say.
- Strengthened systematic quality work – better data for better analysis.
- Improving the quality of core educational activities – development ideas are put to work more effectively when all teachers participate concretely through hypothesis testing in their own classrooms.
It is still too early to say exactly how well the method works in different educational settings. The future will tell.
Designed action sampling in three steps
Now we come to a slightly longer answer to the question of what designed action sampling is:
Designed action sampling is a three-step process.
- First, the research leaders (teachers, peer learning leaders, managers and/or experts) formulate a number of action-oriented tasks for teachers that hopefully create value for students.
- Then many teachers try out the tasks together practically, each teacher in their own classroom with their students, and reflect in writing afterwards and receive feedback from research leaders.
- Finally, everyone analyses together the written reflections including feedback, in anonymised form, and revises the tasks so that they might work better next time.
Then it starts all over again.
In Step 1, the research leaders formulate or select some action-oriented tasks that they believe can create value for learners when teachers try to implement them in their teaching. The tasks can either be based on their own experience in the classroom or based on research, expertise and other experience outside their own organisation, or a combination of these. They can indeed be formulated together with the teachers who are intended to try them out.
In Step 2, all participating teachers collectively, yet individually with their students, try out how these tasks work in their particular classroom. After each trial, each teacher documents how each task went – we’ll get into how this can be done in a simple and practical way in a moment. Documentation is done both via text, through deep written reflection, and via numbers, by rating the emotional state on a scale and choosing freely among different impact indicators, here called “tags”. Tags are short phrases that summarise the desired effects and are designed in advance by the research leaders (teachers, peer learning leaders, managers, experts), preferably in collaboration with all participating teachers. Research leaders provide written, personalised, confidential and timely feedback to each teacher on each reflection.
In step 3, all the data collected is analysed. The analysis begins with the research leaders compiling and visualising all the data collected and then presenting it to all participants in a workshop-style analysis meeting. The analysis is then predominantly collective and results in the revision of the tasks. Then the work starts again from step 1.
The three steps are shown in Figure 4.1 and described in more detail below.
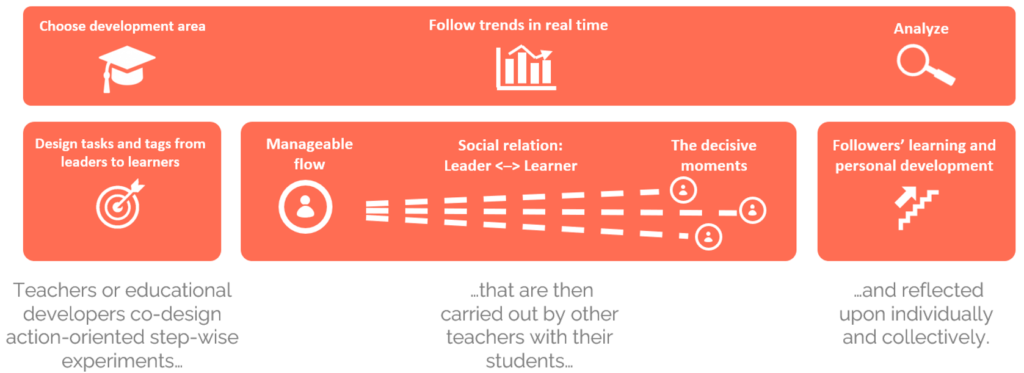
Figure 4.1 The three stages of the work process in designed action sampling.
A form that illustrates designed action sampling
Another way of explaining designed action sampling is to start from the form used for all data collection, see Figure 4.2. The word form may bring to mind bureaucratic exercise of authority, with the Swedish Tax Agency as perhaps the most prominent practitioner[4] , and one can certainly question the value of forms in our society. Is it really another form teachers need? Education is already quite competent with forms. Many different everyday issues are solved in education with yet another paper form – after-school care, homework, absence, action programmes, training, leave, etc.
The main benefit of forms is to structure and simplify the collection of data from many people and to guide those who need to contribute data. A well-designed form can also save time and increase the quality of the data collected. Forms are a common research tool, as the core of science is about collecting and analysing data.
More and more forms are now being digitised online or on mobile phones. This saves time for the person filling in the form, and perhaps above all for the person who has to manage all the data collected. One example of time savings is the time saved by Swedish citizens, and perhaps even more so by the Swedish Tax Agency, when filing the annual tax return form in May. Similarly, in education, a well-designed digital learning platform can save time that would otherwise be spent dealing with routine issues, especially when the teacher is the one who has to receive and manage all the data collected.
Explaining designed action sampling by showing a simple paper form is here mainly a pedagogical approach. In the vast majority of cases, scientific data collection in educational institutions will probably rather be done with different digital tools, such as survey tools or more specialised IT support. However, this is not a book about digitalisation, so all explanations in the book will be based on analogue handling of paper forms. For those who want to try designed action sampling in their organisation on a small scale, it is also possible to work with paper and pencil, even if it may not be the most time-efficient way of working in the long term.
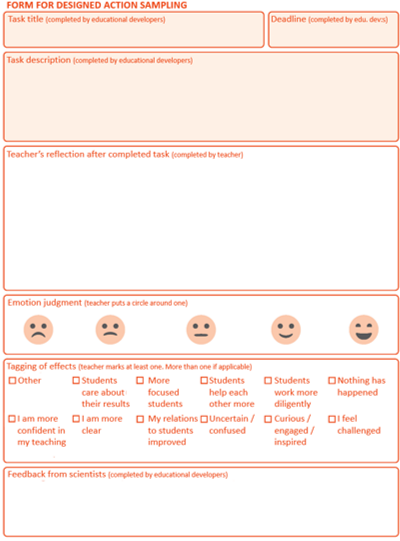
Figure 4.2 Example of a form for designed action sampling.
Example 1: Co-operative learning in primary school
Five primary schools with one hundred teachers in three municipalities wanted to strengthen their work on cooperative learning through designed action sampling. Eleven tasks were created by two experts in the field and carried out by the teachers over five months. The tasks involved developing dialogue patterns and cooperation skills among students, introducing student cooperation in routine tasks, and testing new structures for cooperation in the classroom.
The schools had a need for skills development in this area and accepted the opportunity to try designed action sampling as a method. A needs assessment was followed by a full day of on-site skills development with the experts. Then the teachers were given a new assignment every two weeks to carry out and reflect on. Each teacher received individual and confidential feedback from peer learning leaders, school managers and experts. Half of the assignments were linked to theory and literature, and half were about practical actions in the classroom.
Tags were designed by the experts in consultation with methodological researchers. Some common effects captured by the tags were “Students are more involved”, “Students learn better”, “Students help each other more” and “Increased group cohesion”.
After completing the project, the participants were asked how they perceived the work with cooperative learning and the scientific method. The assignments were perceived as relevant, clear and developing. Many thought that reflecting after each completed assignment provided useful self-insight. A few teachers were a little uncomfortable with sharing their inner thoughts.
Receiving feedback enhanced teachers’ learning and also provided extra motivation. However, sometimes feedback was forgotten, which led to some frustration and disappointment among teachers. Analysis meetings where all teachers could discuss outcomes were perceived as very rewarding. School leaders appreciated the systematic approach and everyone’s participation. The initiative had more impact, effects and problems were made visible and the analysis was deepened when all colleagues worked in a coordinated, documenting and collaborative manner. Visible differences in the level of commitment also provided important information for further leadership.
A combination method with 29 components
Now we finally come to the longest and most detailed way to explain what designed action sampling is:
Designed action sampling is a combination method with 29 different components, see Table 4.1 below.
Table 4.1 Overview of designed action sampling as a research method.
| Overarching theoretical mindset “LOGIC” | Clinical research – We learn by trying to create value for others Pragmatism – We ask what works for whom, when, how and why. Critical realism – We look for weak cause-and-effect patterns on a detailed level. Action-based collective learning – Many people simultaneously try out the same ideas in practice. Abduction – We move systematically and repeatedly between theory and practice. Emotionality – We engage in emotional behaviour, we measure emotions. |
| Working models more strategic “MODEL” | Hypotheses – We formulate hypotheses (tasks) about what can help others. Actions – Teacher do action research on and with each other by selecting/designing assignments. Experiments – We test in the classroom if and how something works in practice. Design Principles – The start and end of the entire research journey is based on design research. Fine-grained – We mix theory and practice fine-grained in everyday life, preferably on a weekly basis. Protocols – We decide what everyone should test, we set deadlines and we maintain a protocol of actions taken. Written – We document all insights and feedback in writing. Confidential – Confidentiality is maintained by having only a few people read all reflections. |
| Practical data collection techniques “TACTICS” | Collection of experiences – Everyone documents via forms continuously in the ‘here and now’, in the same way. Linking action-reflection – When collecting data, action and reflection are linked. Longitudinal data collection – We collect data over a longer period of time and on a weekly basis. Deep reflection – We reflect in depth after each action carried out. Mixed method – We collect both reflections and numerical estimates each time. Emotional assessment – We always make an assessment of emotional state to facilitate analysis Effect coding – We pre-guess intended effects (tags), everyone then codes all the data. Feedback – All teachers receive written feedback from a peer learning leader, manager or expert. |
| Practical data analysis technicians “TACTICS” | Formative analysis – Key insights from the ongoing process are documented on an ongoing basis. Mixed analysis – Numbers guide the search for patterns in collected reflective text Graphical analysis – Matrices and charts are produced to give a good overview. Collegial analysis – Research leaders compile, everyone in the organisation analyses together Anonymous sharing – particularly interesting texts are shared anonymously with all colleagues. Cause-effect analysis – Seeking deep insight into when, how and why effects occur Revised design principles – Insights from the analysis become the basis for revisions. |
The 29 parts are divided into four categories based on how theoretical or practical they are, based on research on how best to describe a method so that the reader is able to understand and apply it.[5] It is important not only to describe theoretical mindsets, but also to be concrete and describe working models and tactics at a very detailed practical level. Figure 4.3 shows a framework that facilitates the description of methods by indicating three levels that need to be described in detail – logic, model and tactics.
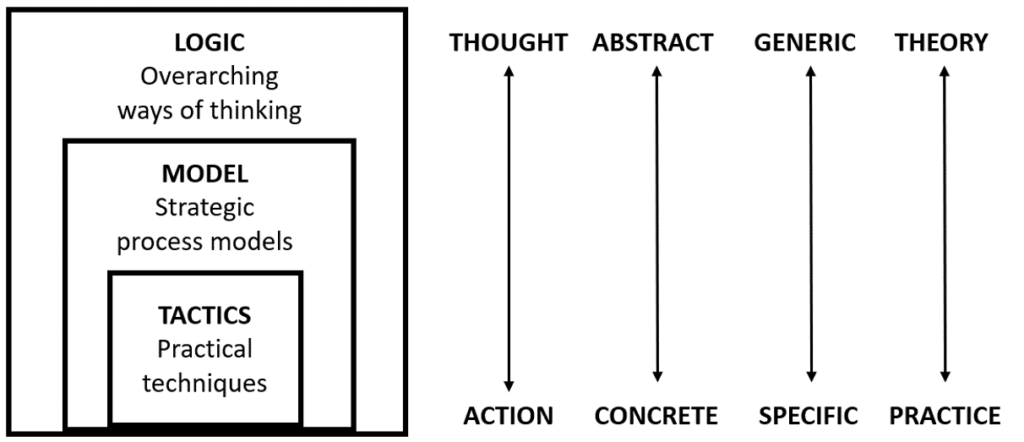
Figure 4.3 Framework with three levels at which a method needs to be described in order for the person trying to apply the method to have the conditions to succeed. Adapted from Mansoori (2018, pp. 49-53).
Logic deals with theoretical thinking at a high level of abstraction and is closely linked to philosophical issues, such as what counts as knowledge (epistemology) and what can be assumed to be real (ontology). Model refers to activities at an overall and thus more strategic level and may consist of step-by-step process or work models that link general, theoretical and abstract ways of thinking with specific, practical and concrete actions. Tactics are tools, techniques and practical methodological approaches that address specific details of the method: how to do things and what effect to try to achieve. Individually, tactics can often seem difficult to relate to each other. It is sometimes only at the level of model and logic that their interrelationship can be understood.
[1] For the theoretically interested reader, combinatorial innovations are the main theme of economist Joseph Schumpeter’s (1934) famous definition of innovation. See also Ogbor (2000).
[2] In addition to Uddevalla, examples of participating municipalities have been Sundsvall, Varberg, Gothenburg, Kungsbacka, Hultsfred, Falkenberg, Åstorp, Skurup, Åtvidaberg, Lerum, Söderhamn, Växjö, Landskrona, Huddinge, Nacka, Skövde and Skara. A number of other organisations have also participated, mainly Skolverket, Chalmers, Me Analytics AB, Region Skåne, Ung Företagsamhet, Ungt Entreprenørskap, Framtidsfrön, Luleå University of Technology, Lund University, University of Huddersfield, University of Wales Trinity Saint David, Aarhus University, VIA University College, Rakkestad ungdomsskole, the European Commission (Joint Research Centre), Esenyurt Halk Egitim Mudurlugu, Mustafa Yesil Ortaokulu, Fridaskolorna and Academedia.
[3] Some research articles that go through different aspects of the method more scientifically are Lackéus (2020a), Lackéus (2020b) and Lackéus and Sävetun (2019a).
[4] More than 500 different forms can be downloaded from the Swedish Tax Agency’s website via an A-Z overview, ranging from form 7580 “Change of address for property owners living abroad” to form 2192 “Personal assets – Profit and loss (help form)”.
[5] See Mansoori (2018). See also Anthony (1963).


